
The Black Liquid
Making sense of a small part of the universe before breakfast
Every time we step outside at night, a profound truth about the universe is staring us in the face: the sky is dark. That means the universe is neither infinite, nor infinitely old. Otherwise the night sky would be filled with light.
What does the night sky have to do with brewed coffee? For one thing, they are both black. For another, brewing a perfect cup can seem as hopelessly out of reach as the end of the universe.
Brewed coffee, drip coffee, filtered coffee, pour-over coffee: here they all mean coffee made by passing water under gravity through a bed of ground coffee and a filter into a cup. We are going to work out how to make a good cup. Following our process of solving hard problems, we first need to define what “good” means.
Brewing is the extraction of chemical compounds from coffee with water. Making good coffee means getting the right amount of the right stuff into the cup: the right extraction yield at the right concentration. The best way to disambiguate those two related but orthogonal concepts is to look at the brewing control chart:
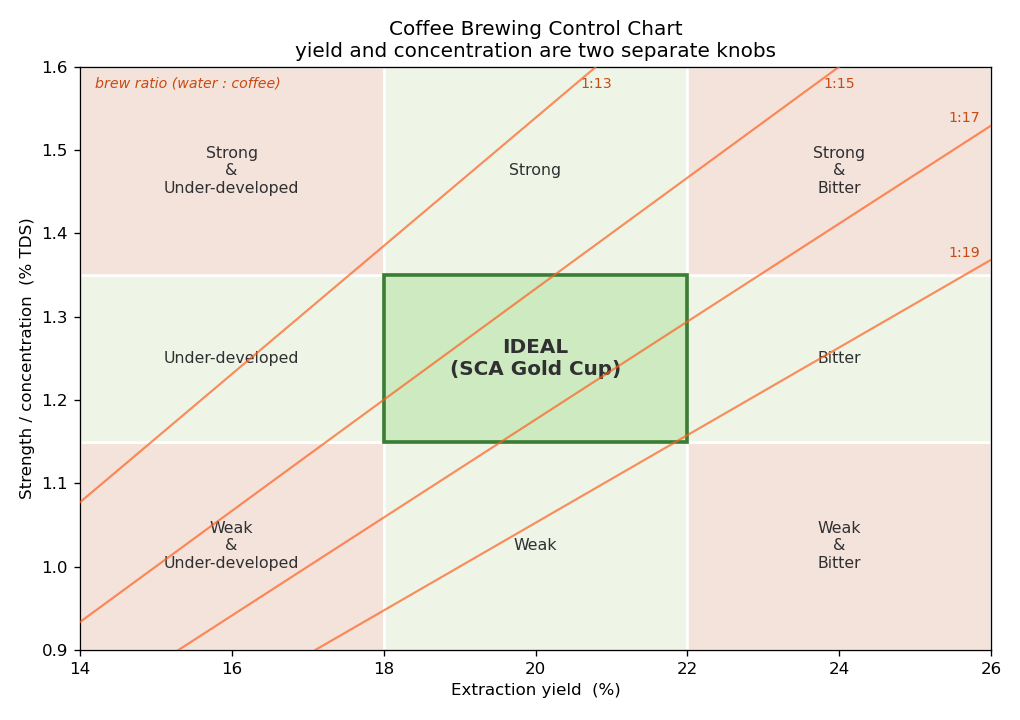
The chart is a map of the cups of coffee we can brew. Each cup occupies one point, fixed by two coordinates: how much of the dry coffee entered the beverage—extraction yield, along the bottom—and how concentrated the result is—strength, up the side. The plane is divided into nine regions. The green box in the middle is the conventional “Gold Cup” target associated with balanced brewed coffee. The diagonal lines are brew ratios: grams of water per gram of coffee. Changing the dose or water moves the brew between those lines.
We can learn from the chart:
- A cup of coffee can be simultaneously too strong and under-developed, or too weak and over-developed.
- A ratio near 1:18 is not a magic number; it simply gives an ordinary filter brew a good geometric chance of passing through the target region.
- Two cups made with the same water-to-coffee ratio can still taste very different. To fix a “bad” cup you need to move it along the given brew ratio line until it lands on the right spot.
We will talk a lot about how to optimize the extraction later (spoiler: average yield is not the only thing that matters). But we cannot declare it fixed without knowing how to measure it. Although extraction yield is difficult to measure directly, we can infer it from concentration:
Here, is extraction yield, is the mass of brewed coffee in the cup or server, and is the starting mass of dry grounds. TDS stands for total dissolved solids. A TDS of 1.35 percent means that about 1.35 grams out of every 100 grams of brewed coffee are dissolved coffee solids; almost all the rest is water.
Can we measure TDS without boiling off the water? Yes, because light slows down when it passes from air into water.
What? Those two things seem completely unrelated. Let me explain the physics first, then come back to coffee. Imagine a wavefront meeting the water at an angle. The near edge enters first and slows, while the far edge continues at its original speed through the air. Because one edge advances more slowly, the wavefront pivots. A light ray travels perpendicular to that wavefront, so it pivots too: the light bends. A marching band does the same thing when it crosses diagonally from pavement onto mud. The marchers who reach the mud first take shorter steps, causing the whole line to swing toward the slower side.
Dissolved coffee solids slow the light a little more, making the beam bend a little farther. A refractometer measures that bending: the steeper the light bends, the more solids in the liquid.
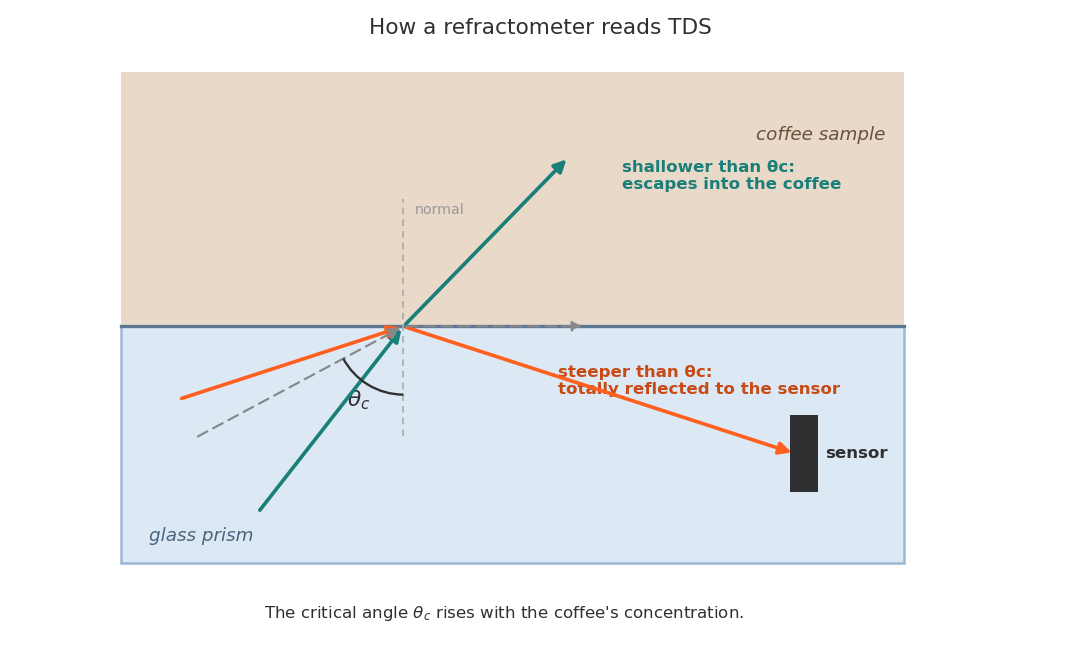
The measured angle is converted into an estimate of TDS using a calibration curve, but that calibration has limits. Oils, suspended particles, bubbles, and temperature can all distort the reading. Because espresso contains far more emulsified oil and suspended material than paper-filtered coffee, its samples require more careful preparation and an espresso-specific calibration.
Fat in espresso may sound surprising, but coffee beans contain roughly 10–17 percent fat by weight. Fat does not dissolve in water, so to carry much of it into the drink, the oil must be broken into tiny droplets that remain suspended—an emulsion. Creating those droplets means creating a new oil–water boundary. In the bulk liquids, oil molecules are surrounded by oil, and water molecules are surrounded by water, held together by favorable interactions with their own kind. At the boundary, some of those interactions are replaced by less favorable oil–water interactions. Nearby water molecules also have fewer ways to orient themselves while maintaining their hydrogen bonds. These energetic and entropic penalties force the boundary into an elevated energy state. The cost per unit area is the oil–water interfacial tension. For a fixed volume of oil divided into spherical droplets, the total boundary area increases as the droplets shrink; halving their radius doubles both the area and the minimum work required to create it.
The high pressure in espresso machines supplies the energy to form emulsions. That emulsion contributes to espresso’s sheen and heavy body. Pour-over does not have that energy, and paper captures much of the oil it does release, producing a cleaner cup. Personally, I do not like espresso’s mouthfeel enough to devote the rest of this chapter to it. From here on, we will stay with brewed coffee.
Roasting: Making the Bean We Brew
Long before water reaches coffee, roasting determines both the chemicals available to extract and the physical structure from which they must escape. Under heat, green coffee undergoes chemical and physical changes.
Chemical changes
- Decomposition reactions generate carbon dioxide. Sugars, proteins, and acids break down under heat, and the reactions that build flavor also release gas. Some carbon dioxide remains trapped in the bean and later drives the bloom; the amount depends on roast development, porosity, freshness, and storage.
- Fruity and acidic compounds degrade in stages. Citric and malic acids inherited from the green bean, along with many volatile esters and terpenes behind floral and fruity aromas, are heat-sensitive. They steadily break down or boil off. Chlorogenic acids degrade into other compounds, some of which contribute bitterness.
- Maillard reactions and caramelization build new flavors. Nutty, caramel, roasted, and chocolate notes grow as some of the original fruit character recedes.
The tradeoff is easy to taste: a light roast tends to speak more clearly of where the coffee came from; a dark roast speaks more loudly of what the roaster did to it.
Physical changes
- Moisture evaporates, drying the bean.
- Internal pressure expands and ruptures cell walls. Water vapor and carbon dioxide stretch the cellular structure, turning a dense seed into a brittle, porous foam. As roasting continues, the bean generally becomes larger and less dense.
- Microscopic cracks develop in the stretched walls.
- Oil becomes more visible at the surface. Roasting opens the structure that once held the oil inside cells and lowers its viscosity. Darker roasts are therefore more likely to look oily.
What leaves the roaster is a brittle, porous foam: gas trapped inside, oil increasingly exposed, and a chemical inventory transformed by heat. That is what we have to work with. Before choosing a grinder or pouring technique, it helps to understand how material escapes from it.
Extraction: Moving Flavor into Water
A roasted coffee bean contains thousands of chemical compounds. How quickly they move into water is affected by two intrinsic properties of the compounds and the roasted matrix:
- Water solubility. Dissolving means that water molecules surround a compound and pull it away from the solid. Water molecules are small and polar, so many small polar molecules, including organic acids and some aroma compounds, dissolve readily. Sucrose molecules are slightly bigger so they dissolve a little slower.
- Binding and structure. Compounds trapped deeper in the bean’s cell structure, or tied up in larger carbohydrates and woody cell-wall material, take longer to extract and tend to show up later as bitterness, dryness, or thinness.
The following table gives a rough sense of the range involved:
| Compound | Approximate size | Functional groups | Structural complexity |
|---|---|---|---|
| Caffeine | Small (~24 atoms) | Nitrogen and methyl groups | Fused ring structure |
| Citric acid | Small (~21 atoms) | Carboxyl and hydroxyl groups | Small, highly functional molecule |
| Chlorogenic acid | Larger (~43 atoms) | Carboxyl, hydroxyl, and ester groups | Multiple linked ring structures |
| Sucrose | Larger (~45 atoms) | Hydroxyl groups and a glycosidic bond | Two linked sugar rings |
| Cellulose | Very large polymer | Hydroxyl groups and glycosidic bonds | Long, tightly packed chains reinforcing cell walls |
| Lignin | Very large, heterogeneous polymer | Phenolic, ether, and methoxy groups | Cross-linked aromatic network resistant to water and breakdown |
Simplified accounts of coffee extraction often suggest that these compounds leave the bean in a fixed order. In reality, their extraction overlaps: many compounds dissolve at once, but at different rates. In flavor terms, a cup often moves from sour and aromatic, through sweet and rounded, toward bitter, dry, and thin as extraction proceeds.
Once roasted beans reach the kitchen, we cannot change which chemicals they contain. The good news—or bad news, depending on your perspective—is that solubility and structure are not the only things controlling extraction. We still control particle size, temperature, time, and the movement of water.
The physics of diffusion
It is useful to think of extraction as two linked steps. First, soluble compounds must move from the particle interior to its surface. Second, once they reach the surface, moving water must carry them away. The first step is dominated by diffusion through the porous particle. The second involves advection: transport by the bulk motion of the liquid.
A roasted coffee grain is not a solid lump. Roasting pyrolyzes the cell structure into a rigid but highly porous matrix, something like a sponge. When water reaches a particle, it wicks into this network. Soluble compounds dissolve into the water held inside the pores, then diffuse along tortuous, water-filled paths before the bulk flow can carry them away.
As we saw in the salt chapter, Fick’s second law gives a scaling law for the characteristic diffusion time across a particle of radius :
Here, is the effective diffusion coefficient inside the porous grain. Size matters: doubling a particle’s radius makes its interior take roughly four times as long to drain. The wider the range of particle sizes, the wider the range of extraction times.
Once compounds reach the surface, extraction becomes a boundary-layer problem like the one we encountered in heat transfer. Water immediately next to the solid moves relatively slowly, so dissolved molecules must cross a thin concentration boundary layer before the main flow carries them away. The Noyes–Whitney equation shows what controls the dissolution rate:
Larger surface area , a larger diffusion coefficient , and a thinner boundary layer all speed up removal. The concentration difference between the saturated particle surface and the surrounding brew water supplies the driving force. is the volume of water receiving the dissolved compounds.
How temperature changes extraction
Both the diffusion scaling law and the Noyes–Whitney equation contain a diffusion coefficient, a measure of molecular mobility. Over the temperature range relevant to coffee brewing, the Arrhenius equation shows that the coefficients increase with increasing temperature:
Here, is a pre-exponential factor, is the apparent activation energy for diffusion, is the ideal gas constant, and is absolute temperature in kelvin.
Different compounds have different values of and , so heat does not accelerate every part of extraction equally. The illustrative graph below shows the important direction: every compound class extracts faster as temperature rises, but not necessarily by the same amount.
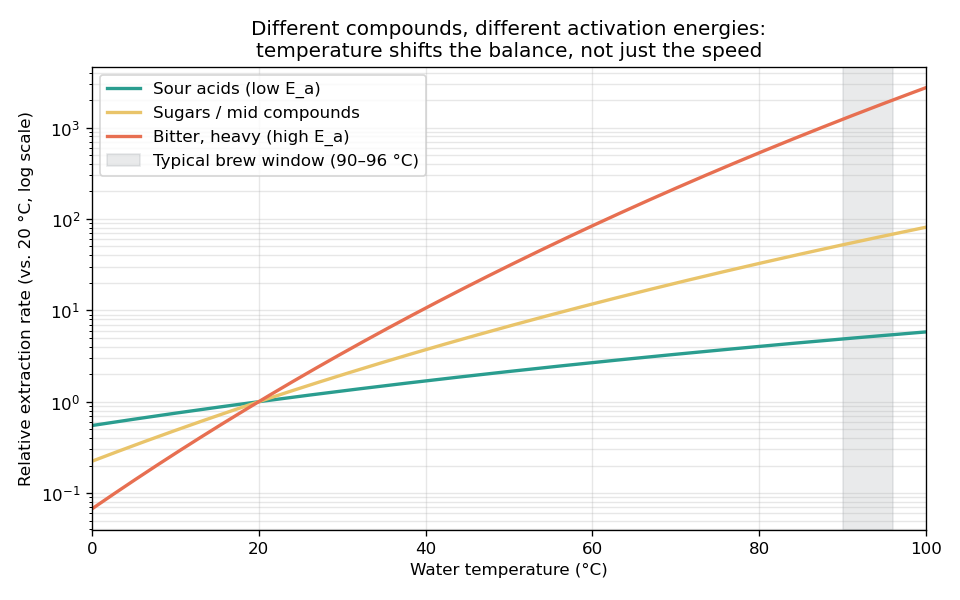
This is why cold brew has its fans: lower-temperature brewing shifts the relative balance of what is extracted, contributing to the smoother, less bitter character.
Roast level changes the curves as well. A light roast’s dense, less fractured matrix can become a shared bottleneck that slows almost everything, so all three curves shift down and move closer to each other. This is why light roasts often tolerate—or require—hotter water to reach sweetness without runaway bitterness.
The equations show that extraction is governed by surface area and diffusion distance. Both are fixed at the instant of grinding.
Grinding: Setting the Geometry
We now come to the first decisive mechanical step. The grinder sets the geometry of the entire extraction problem before a single drop of water arrives. For a home coffee setup, it may be the most important piece of equipment.
The Science of Crushing Coffee Beans
Solids under pressure respond in one of two ways:
- Elastic deformation. Atoms and molecules shift slightly within their current arrangement, stretching bonds and contacts. When the load is removed, they return toward their original positions and the material recovers its shape.
- Plastic deformation. Molecular segments cross energy barriers and settle into new arrangements by sliding or rotating. The shape change remains after the load is removed, and some of the applied energy is dissipated as heat.
A material is brittle when it fractures while its deformation is still mostly elastic. A material is ductile when it undergoes substantial plastic deformation before it breaks. Put more plainly, a brittle material cracks; a ductile material yields, bends, flattens, or smears.
Coffee beans normally behave as a brittle material during grinding because the load rises faster than their molecular segments can rearrange. The segments are trapped in their current arrangement while covalent bonds stretch and bend, intermolecular contacts distort, and cell walls flex around their pores. These distortions store the applied work as elastic energy. At the narrow end of an existing fissure—the crack tip—the distortion is especially severe, so bonds there break first. Their failure lengthens the crack and allows the material behind its new tip to spring back, releasing some of the stored energy. If that released energy breaks the next bonds, the process repeats. Once each step supplies enough energy to drive the next one, the crack runs rapidly through the bean.
Roasting prepares the bean for this process before any force is applied. As water and gases escape, the cellular structure expands, leaving thin walls crossed by pores and microscopic fissures. The bean therefore does not have to create every crack from scratch: an applied load can enlarge existing defects and connect neighboring pores. Each new fragment inherits the same defect-rich structure, making further fragmentation easy.
Experiments have found narrower particle-size distributions from cold beans under some grinding conditions. One hypothesis is that cooling slows molecular rearrangements, so a larger share of the deformation remains elastic instead of plastic. The beans therefore fracture sooner rather than deforming and surviving repeated loads, reducing both large survivors and the fines generated by repeated fracture. There might be some justifications to the trick of storing coffee beans in the freezer.
Roast level changes the structure being loaded. A darker roast has lost more mass and expanded farther, leaving thinner cell walls, more pore space, and more microscopic fissures. It is therefore less dense and generally easier to fracture. The density difference remains visible after grinding: a fixed mass of dark-roast coffee usually occupies more bulk volume than the same mass of light-roast coffee. As discussed in the roasting section, darker-roasted beans are also more likely to carry oil on their surfaces. Here, the relevant consequence is mechanical: the oil can coat fragments and grinder surfaces, encouraging smearing, clumping, and retention.
The Science of Particle-Size Distribution
A brewer never encounters one crack or one particle. It encounters millions of particles, each with its own size, shape, surface area, and history. We now move from the microscopic question—how does a bean break?—to the macroscopic one: how does a grinder turn all those breaks into a population of sizes?
The formal tool for studying that transition is a population balance equation. Suppose we sort the coffee inside the grinder into size classes, ordered from smallest to largest. Let be the total mass of coffee in size class . The equation tracks the three physical mechanisms that change during grinding: feed, fracture, and escape.
Read from left to right, the four terms account for four flows of mass:
- Feed adds mass. is coffee entering the grinder in size class .
- Breakage removes mass. is material that leaves class because its particles are selected and fractured.
- Breakage also adds mass. The sum collects daughter fragments that enter class when larger particles in classes break.
- Escape removes mass. is material that leaves class by exiting the grinder.
The middle two describe opposite sides of the same fracture event: a parent disappears from one class and its daughters appear in smaller classes. Once the feed is specified, the grinder is characterized by three things: the selection rate , the breakage distribution , and the escape rate .
The particle-size distribution is the accumulated result of those three functions. The population balance is not meant here as a numerical model—we do not know all its coefficients for a coffee grinder—but as a disciplined way to reason about the machine.
Grinder Design as Population Control
This framework turns grinder design into a concrete objective: control which particles break, how they break, and when they escape. If similar fragments follow similar paths through the grinder, they leave within a relatively tight size range. If some fragments escape after one fracture while others are trapped and broken repeatedly, the distribution develops fines at one end and boulders at the other.
Particle size affects extraction and flow. Smaller particles have more surface area per unit mass and shorter internal diffusion distances, so they extract faster. During the same brew, small and large particles can therefore contribute different balances of soluble compounds. Even a small mass of fines can fill pores between larger particles and sharply reduce bed permeability. Consequently, two grinds with the same central size can brew very differently when the widths and tails of their distribution differ.
A controlled, relatively tight distribution generally makes brewing easier to tune and reproduce, but the desired shape depends on the method. Filter coffee usually benefits from fewer fines, whereas espresso requires enough fine material to create flow resistance. The goal is therefore not always the narrowest possible distribution, but a controlled and repeatable one suited to the brew.
Blade Grinders: Random Selection, No Size-Selective Escape
A blade grinder is a spinning propeller inside a closed chamber. Tumbling selects whichever particle happens to cross the blade, impact breaks it, and every resulting fragment remains available for selection until the user stops the machine. There is no opening that lets a fragment escape because it has reached the target size.
The population therefore accumulates unequal histories. Some pieces avoid the blade and remain large; others are struck repeatedly and become fines. More time shifts the population toward smaller sizes, but it does not make selection or escape size-dependent. Pulsing and shaking improve mixing, not classification.
A blade grinder produces a broad distribution whose center and spread depend on grinding time, dose, and chance. The price to pay for a low price is low repeatability.
Burr Grinders: Staged Selection and Size-Selective Escape
A burr grinder gives the population a path. Coffee enters between two ridged surfaces, coarse teeth select and break the largest pieces, and progressively finer features act on the fragments as the burrs transport them toward the exit. Near the end of that path, the gap and finishing teeth act as an imperfect classifier: fragments small enough to pass can escape, while larger fragments remain available for another loading event. Changing the gap therefore changes selection and escape together and shifts the output predictably.
Conical and Flat Burrs: Different Population Paths
There are two kinds of burr sets: In a conical set, beans fall into the wide annular opening between an inner cone and an outer ring. Coarse, angled teeth capture them and draw the fragments along a narrowing path to the finishing gap, where the grounds escape. Gravity keeps the inlet supplied even at low rotational speeds, while the nested geometry fits a long grinding path inside a narrow body. This combination makes conical burrs well suited to compact hand grinders.
In a flat set, beans enter near the center of two facing discs. Inner teeth capture and pre-break them; rotation and the channels between the teeth carry the fragments radially through finer zones; grounds escape at the outer circumference. A large flat set requires a wider chamber and is commonly paired with an electric motor because such grinders are usually designed for higher throughput.
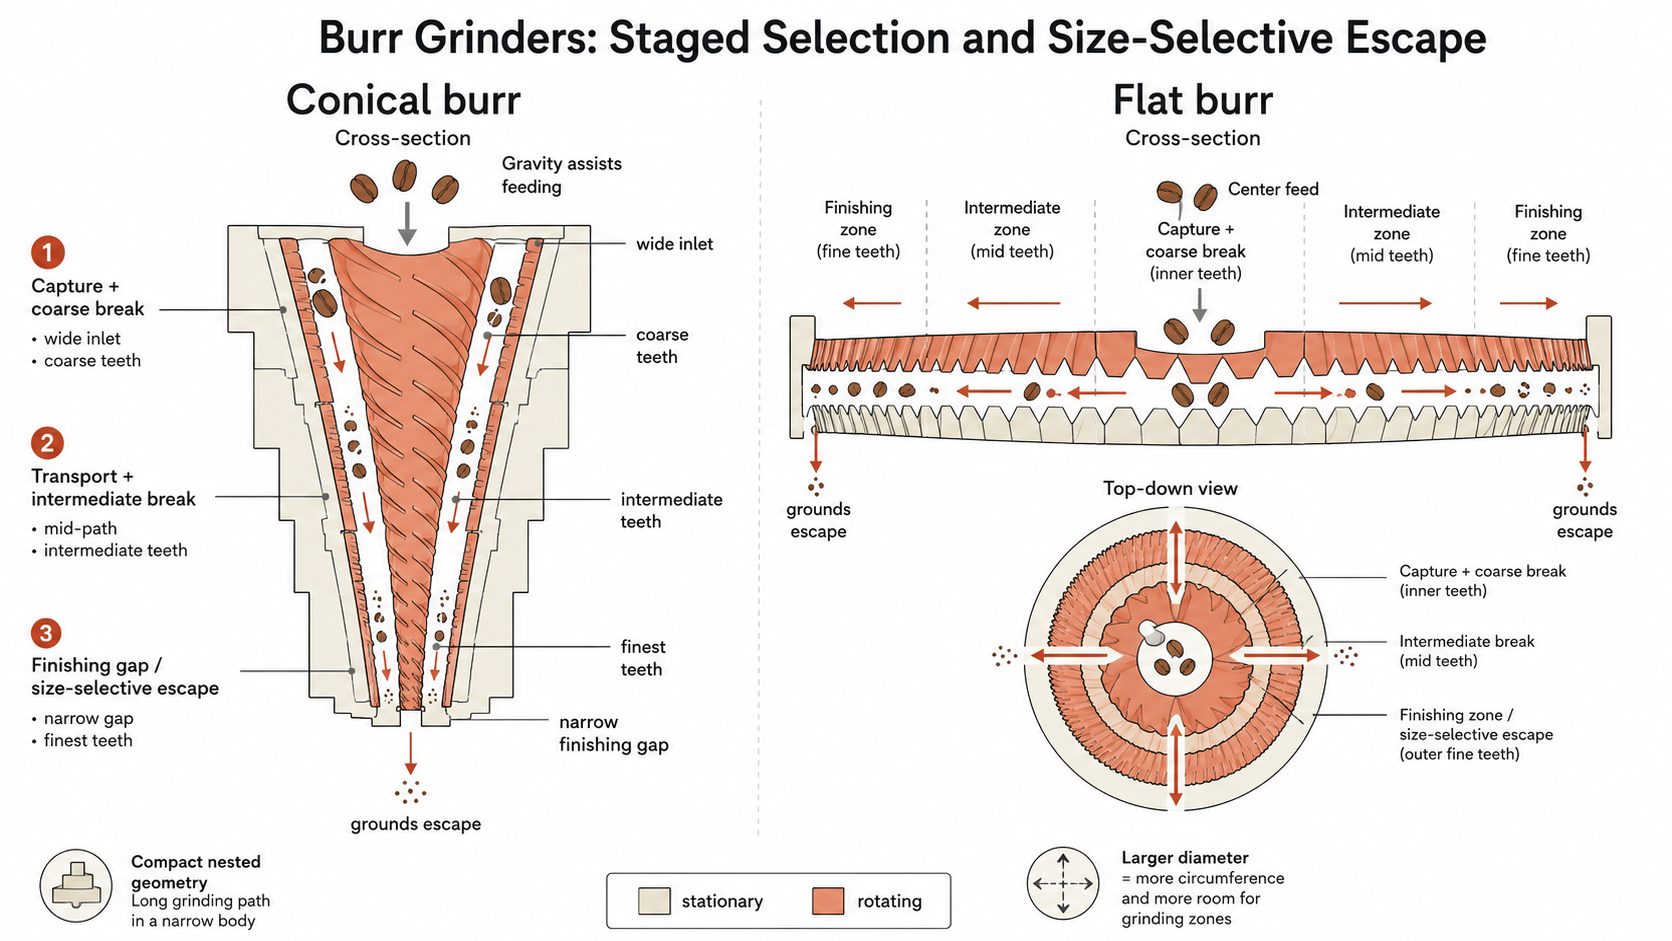
In one analysis of 24 espresso grinders, conical-burr grinders produced more fines and broader coarse-particle peaks on average than flat-burr grinders. The two groups overlapped substantially, however, so a particular flat-burr grinder can be less unimodal and less uniform than a particular conical-burr grinder. Burr shape describes a tendency within this sample, not the performance of an individual grinder. Tooth pattern, burr diameter, alignment, feed control, exit geometry, and speed may matter as much as the overall form. In serious grinder-nerd circles, the discussion goes deeper. One example is RPM—the speed at which the burr spins.
In theory, changing RPM can affect all three population-control functions:
- Selection: it changes how often teeth encounter particles and how steadily beans enter the grinding path.
- Breakage: it changes the rate and velocity of loading and may change the balance among cracking, chipping, and rubbing.
- Escape: it changes how the burr transports fragments and how quickly they clear the finishing zone.
Changing RPM is not a straight path to better particle distribution. If selection, breakage, and escape change in step, a new speed may only finish the dose sooner. Low RPM can create more fines if particles linger during uneven feeding or clearing: a slower grind can keep each gram in the grinder longer, which might even raise the grounds temperature. RPM also says little without burr size, because a large burr reaches the same tooth speed at fewer revolutions.
Variable speed can be a useful tuning control for a specific burr and chamber, but it is not a requirement for a good grinder; many excellent designs run at one carefully chosen speed. When flavor does change, RPM may be moving several linked variables at once—particle distribution, throughput, retention, static, and temperature—so no speed is universally best.
Hand and Electric Drives: Sustaining the Process
Once an operating speed has been chosen, the drive must sustain it while the load changes. The torque required to crush the beans and the RPM are related to the drive power:
where is power in watts and is torque in newton-meters.
A human arm is a low-speed, high-torque drive. When a hard bean raises the resistance at the handle, the user naturally pushes harder or slows down. An electric grinder must supply enough torque to hold its target RPM. A capable motor and controller respond to load changes while maintaining speed, replacing the user’s arm while adding consistent RPM and higher throughput. In premium grinders, part of the price pays for that torque reserve and control.
The inconsistent RPM of a hand grinder changes instantaneous selection and transport and may also alter breakage, but the burr path and gap still provide staged fracture and size-selective escape. A hand grinder is not inherently less capable of producing a controlled distribution. Because it needs no motor, gearbox, or electronic controller, more of its price can go into the burrs, bearings, adjustment mechanism, and alignment. Its costs are human effort and low throughput, especially with light roasts or fine settings.
Fines in the population balance
Fines are not evidence that a grinder has failed. Imagine cutting wood with a precise saw: however controlled the tool, the cut still produces small chips and fine sawdust. Grinding coffee is similar. Better control can shape the particle distribution, but it cannot eliminate fines. Cracks split the bean’s porous, heterogeneous structure into large pieces while branching through cell walls to release much smaller debris.
The useful target is therefore not “zero fines” or even “the narrowest possible distribution.” A filter brew often benefits from fewer fines because permeability and clarity matter. Espresso needs a fine population that can provide both rapid extraction and substantial flow resistance. A good grinder produces a distribution that suits the brewing method and does so repeatably.
Measuring the Particle-Size Distribution
After all that, how do we close the loop and know what the grinder has done? The instrument used to measure PSD is a particle-size analyzer. It reports the full distribution as well as percentile diameters such as , , and . The is a median: half of the reported distribution lies below it and half above. Here is the twist: different analyzers can weight the distribution differently, so “half” may refer to particle number or particle volume. The resulting values are different quantities and can differ greatly for the same coffee.
A laser-diffraction analyzer disperses the grounds in air or liquid and passes them through a laser beam. Detectors record the intensity of scattered light at many angles: large particles scatter more strongly at small angles, while small particles send more light toward wider angles. Software works backward from the combined scattering pattern to infer the mixture of sizes that produced it.
Laser diffraction is an ensemble measurement: the instrument sees the combined optical signal, not individual grains. It normally reports a volume-weighted distribution of equivalent spherical diameters. Because particle volume scales approximately as , one 1,000-micrometer particle contributes about as much volume as one thousand 100-micrometer particles. Large particles therefore carry far more weight in a volume distribution. A volume-weighted distribution shows which particle sizes account for most of the grinder’s output by volume, but it can make a numerous population of fines look deceptively small.
The word “equivalent” also matters. Coffee fragments are irregular and porous, so the reported diameter is the diameter of a model sphere that would produce a comparable scattering signal, not a width measured directly with a ruler. Clumps can appear as large particles if dispersion does not separate them, while particle shape and the assumed optical properties can change the inferred distribution.
An image analyzer spreads out the grounds, photographs individual particles, and measures projected features such as length, width, area, or circle-equivalent diameter. Home-oriented instruments such as the DiFluid Omni belong to this category. Imaging reveals shape and allows each visible particle to receive one vote in a number-weighted distribution. In that representation, a fine and a boulder count equally, so a large population of fines can pull the sharply downward even though the fines contain little of the total coffee mass.
Image analysis has its own blind spots. Particles below the camera’s resolution or the instrument’s stated lower size limit are not counted reliably; touching particles may be mistaken for one; and a two-dimensional image cannot reveal a particle’s thickness. Some image software converts its measurements into an estimated volume distribution, but that conversion requires assumptions about three-dimensional shape.
A laser-diffraction curve and a number-weighted image curve can make the same grind look like two different powders. Neither view alone tells the whole brewing story: bulk volume helps describe the main grind, while a small fine fraction may reveal more about mouth feel and flow resistance.
When comparing grinders, a is meaningful only when the measurement method, weighting, size limits, dispersion procedure, and diameter definition are the same, and the sample preparation methods are consistent.
Sample Preparation Is Part of the Measurement
A particle analyzer only sees the sample placed in front of it. For a home user, a poorly prepared sample will not accurately reflect the quality of the grind.
First, the sample must then represent the entire dose. Grounds segregate while falling, shaking, and pouring: fines can percolate toward the bottom of a cup while larger particles remain nearer the top. A small scoop from one location can therefore report a different distribution from the dose as a whole. A laboratory uses a riffle splitter or coning-and-quartering procedure to produce a smaller but representative sample. If your home setup does not allow you to analyze the whole population, gently mix the grounds and take several small portions from different locations.
An image analyzer needs a sparse, single layer in which particles do not touch or overlap. A clump may otherwise be counted as one boulder, while aggressive scraping can crush fragile particles and create new fines. A vibrating dispersion plate, such as the one used by the DiFluid Omni, makes this step more repeatable, but it cannot correct a sample that was unrepresentative before it reached the plate.
Static and moisture must also be controlled. Static can keep fines inside the grinder, attach them to larger particles, or leave them behind in the dosing cup. Lightly misting the beans with water before grinding can reduce those effects.
Finally, measure enough coffee and repeat the test. Record the bean, roast, dose, grinder setting, whether the beans were misted, analyzer mode, weighting, and lower size limit. If an image analyzer cannot detect particles below 100 micrometers, for example, its graph says nothing about the population below 100 micrometers; an empty region there is a measurement boundary, not proof that the grinder produced no fines.
Practical Implications for Home
- Buy a burr grinder before an elaborate brewer. The grinder determines the geometry inherited by every later step.
- A hand grinder can be excellent value. It exchanges speed and convenience for a larger share of its cost going into the burr and its support.
- For an electric grinder, value speed stability under load. Raw RPM and motor wattage reveal little by themselves.
- Do not pay for controls you don’t need. To understand what changing the control does, it takes a lot of work to close the loop: design experiments that separate the effects of different variables, prepare consistent samples, measure the PSD, and understand the results.
- Match the distribution to the brewing method. Filter, espresso, immersion, and very fine brewing do not ask for the same balance of surface area and permeability.
- Re-dial when the coffee changes. Roast level, bean temperature, and moisture alter selection and breakage.
- Keep burrs clean, sharp, and aligned. Population control is only as good as the geometry that creates it.
Once the particle population is set, water can go to work with the geometry it has been given.
Brewing: Water Through the Bed
The coffee bed is a porous medium
A coffee bed belongs to the same broad class of flow systems as a sand filter, an aquifer, or groundwater flowing through sediment: solid particles form a skeleton, and fluid moves through the connected voids between them. Actually, much of the science discussed here is borrowed from the study of soil physics, groundwater hydrology, filtration, and packed-bed engineering. Darcy’s law is the standard tool for analyzing flow through such a porous bed:
Here, is volumetric flow rate, is bed permeability, is cross-sectional area, is the pressure drop across the bed, is water viscosity, and is bed depth.
Brewer and filter geometry set the boundaries of this flow problem. A conical dripper creates a deep central bed and converging flow near its outlet, while a flat-bottom brewer spreads the bed over a broader area. Paper traps much of the suspended fine material and oil, but it also adds hydraulic resistance. Metal filters pass more of both and generally produce a heavier-bodied drink. Even the way a paper filter seals against the brewer can change drawdown while every number in the recipe remains the same.
Why do we care about flow? Because flow shapes extraction. As established earlier, faster flow near a particle’s surface maintains the concentration difference that drives dissolution. Where flow stagnates, the nearby water loses that driving force and extraction slows. At the macroscopic level, the hydraulic goal comes down to one thing: maintaining uniform flow across the entire coffee bed.
Once the brewer, filter, and dose are fixed, the geometry terms and are largely set. Water temperature affects viscosity, but the two practical flow variables to focus on are the pressure drop and bed permeability .
Pour-over has little pressure to spare
In pour-over, the pressure drop comes primarily from the hydrostatic pressure of the water column:
where is the density of water, is gravitational acceleration, and is the height of the water above the outlet.
Five centimeters of water provides only about 500 pascals. An espresso machine operating near nine bar provides roughly 900,000 pascals. That’s why permeability has a much bigger impact on the drawdown time in pour-over. It only has a few centimeters of gravity head, whereas an espresso machine can apply much greater pressure to drive water through.
Permeability: the variable blooming improves
Permeability is determined by particle size, particle shape, packing, and the fraction of fines. The Kozeny–Carman relation shows that uneven particle size leads to uneven permeability:
Here, is a representative particle diameter, is the fraction of the bed occupied by void space, and collects the effects of particle shape and path tortuosity.
However, Kozeny–Carman describes the intrinsic permeability of the particle skeleton and implicitly assumes that connected pores are filled with liquid. If water saturation varies across the bed, different regions have different effective permeability:
Here, is the local water saturation and is the relative permeability. Wetted regions have a higher , while dry or gas-blocked regions have a lower one.
Blooming is the small initial addition of water, followed by a short wait, before the main pour. It exists because water does not immediately saturate every particle when it first hits a dry coffee bed. Roasting produces and traps carbon dioxide in the bean’s pore network. This gas keeps water out of isolated dry regions even if the surface of the bed is evenly wetted. If the main pour begins too quickly, gravity-driven flow follows paths that are already wet and permeable, reinforcing the initial imbalance.
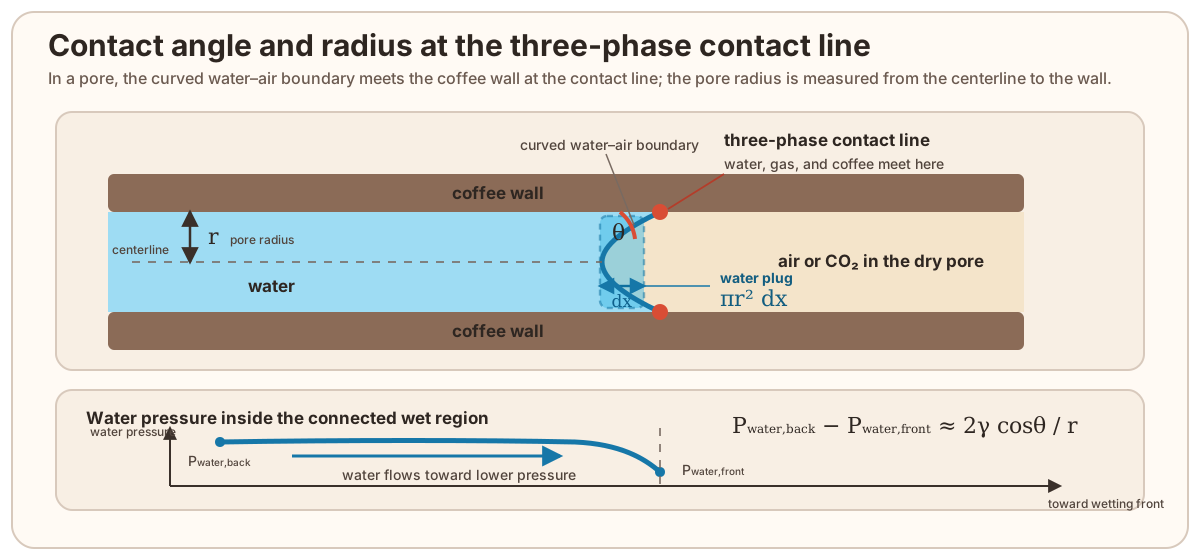
Water can still reach dry spots through capillary action: the spontaneous movement of liquid through narrow spaces, even sideways or upward against gravity. The deeper reason is an energy balance at the moving contact line, where water, gas, and coffee solid meet.
Imagine one ideal cylindrical pore of radius . If the wetting front advances a tiny distance , it wets a new strip of pore wall with area . That motion replaces coffee-air interface with coffee-water interface. For a wetting surface, the replacement lowers surface energy because polar and otherwise hydrophilic sites on the coffee surface can form energetically favorable interactions with water molecules. Young’s relation packages the energy gain per unit area as , where is the water-air surface tension and is the contact angle measured through the water. The surface-energy drop is therefore approximately:
That released energy does pressure work on the small plug of water that moves forward. The plug volume is the pore cross-section times the same distance, , so the pressure work is:
Equating the two gives the capillary pressure:
This equation shows that the narrower the pore (smaller ), the greater the push forward.
Capillary action is not instantaneous, especially in a winding bed of irregular particles. The waiting period gives water time to creep into dry pockets while trapped is pushed out. The visible swelling and bubbling are what give the blooming phase its name, but the real goal is to help water reach every nook and cranny in the bed.
A gentle early swirl can break clumps and create new points of contact from which wetting can continue. Once the bed is uniformly wetted and its most vigorous expansion has subsided, the main pour enters a bed whose hydraulic resistance is more uniform and predictable.
Channeling and bypass
Water favors paths of lower resistance. A region that is loosely packed, already wet, or relatively free of fines carries more flow; a dry, compacted, or clogged region carries less. This preferential flow is called channeling. Some grounds may be washed repeatedly while others barely participate. The average extraction yield can look respectable while the cup tastes both sharp and bitter.
Channels can begin with an uneven bloom, a stream that repeatedly strikes one spot, a sloped bed, or a patch clogged by fines. They can also reinforce themselves. Once one route accepts more water, neighboring regions may compact or shed fines, leaving the shortcut with an even larger share of the flow.
Bypass is a related but distinct shortcut. It is water that reaches the server without traveling through the coffee bed in the intended way—perhaps down a gap between the filter and grounds, or through a loosely packed region at the wall. Bypass dilutes the beverage while contributing little extraction. Pouring at the wall to “wash down” every visible ground can therefore make the cup thinner without making extraction more even.
A roughly flat spent bed is useful evidence that flow was reasonably symmetric. It is not proof of even extraction—the important events occurred inside the bed—but a sharply tilted bed or a deep crater is a warning that the flow field was not uniform.
The main pour reshapes permeability
After the bloom, the main pour starts. In most recipes, the only thing that disturbs the coffee bed (and changes the permeability) is the falling stream from the kettle.
The kettle therefore performs three jobs at once. It replenishes the water column that supplies the pressure head, determines where fresh water enters the bed, and supplies momentum that rearranges the grounds. Saying that a recipe uses three pours describes only the first of those jobs.
For a given kettle and flow rate, the stream gains momentum as it falls—but only while it remains coherent. As the stream stretches and narrows, surface tension amplifies small necks until it breaks into droplets, a process called the Plateau–Rayleigh instability. The strongest controlled impact comes from the greatest height at which the stream still reaches the slurry as a continuous column. Raising the kettle farther produces scattered droplets rather than a stronger, well-placed impact.
That impact rearranges particles and changes porosity. Gentle agitation early in the brew can make the bed more uniform. Too much agitation can mobilize fines. A fine begins to migrate when hydrodynamic drag from the pore water overcomes the contact, frictional, and adhesive forces holding it in place. Faster local flow increases the force available to detach and carry particles. Once mobilized, fines travel with the pore water until they get stuck somewhere else. Many eventually collect near the paper or in regions where flow converges or slows. There they can turn a permeable layer of coarse particles into something more like silt. As falls, Darcy’s law says that falls with it.
This is why two brews made with the same coffee, grind setting, dose, and pour schedule can finish at different times. The written recipe was identical; the internal arrangement of the bed was not. One pour may have mobilized enough fines to form a restrictive layer, while the other left them more evenly distributed.
Therefore maximum impact is not always the goal. Agitation can accelerate extraction by renewing the water around each particle, but it can also damage the permeability that the rest of the brew depends on. The usual defense is deliberately unexciting: wet evenly, agitate early and gently, avoid driving the stream into one spot, and keep the pour rate reasonably steady. If the bed begins to stall, more vigorous stirring is likely to make the hydraulic problem worse.
Water is an ingredient
Uniform flow is a hydraulic goal, not a complete recipe for good coffee. The water itself also changes what is extracted and how the cup tastes. By weight, about 98.5 percent of brewed coffee is water. Yet most natural water is not pure . As water moves through limestone or dolomite, it often picks up calcium and magnesium ions along with bicarbonate. General hardness and alkalinity therefore tend to rise together, but they are distinct properties and affect coffee differently.
General hardness mainly describes dissolved calcium and magnesium. Both are divalent cations: they carry two positive charges. Many acids and flavor molecules in coffee contain carboxyl, carbonyl, or hydroxyl groups whose oxygen atoms create locally negative regions. Positive ions are attracted to those regions and can grab onto the molecules.
Molecular calculations have compared how strongly calcium, magnesium, and sodium bind to seven representative coffee compounds. Magnesium has the same charge as calcium in a smaller radius, giving it a more concentrated electric field; sodium carries only one positive charge. The model therefore predicts the strongest binding from magnesium, an idea that helped inspire recommendations for magnesium-rich brewing water. A later experiment, however, found only small changes in the extraction of four organic acids at concentrations typical of drinking water. Some sensory effects may instead arise from interactions within the finished drink.
A household ion-exchange water softener replaces calcium and magnesium with sodium or potassium. That prevents scale, but it also removes the ions predicted to interact most strongly with coffee compounds. Because the softener does not necessarily remove bicarbonate, the resulting water can have little general hardness while retaining much of its alkalinity.
Alkalinity measures the water’s capacity to neutralize acid, usually because it contains bicarbonate:
Too much alkalinity mutes coffee’s bright acidity and can make the cup taste flat. Very low alkalinity can leave the same coffee tasting sharp.
For brewing, use clean water without chlorine odors, with moderate mineral content and modest alkalinity. Distilled water is a useful blank for building a controlled recipe, but by itself it often produces an unconvincing cup. Extremely hard water creates its own flavor problems and coats kettles with scale. If good coffee brewed through a well-behaved bed still tastes strangely dull, the water becomes a prime suspect.
Temperature also changes the hydraulic system. Hotter water is less viscous, so Darcy’s law predicts faster flow if the bed and pressure head stay the same. It also increases molecular mobility and changes extraction kinetics, as we saw earlier. A temperature adjustment is therefore both a chemical and a hydraulic adjustment.
Explore the coupled system
Grinding finer speeds diffusion but reduces permeability. More agitation renews the boundary layer but can move fines and stall the bed. Hotter water extracts faster and flows more easily. A deeper bed changes both resistance and contact time.
The Pour-Over Simulator brings those couplings together. Change grind size, fines fraction, water temperature, bed depth, and agitation, then follow the modeled effects on permeability, drawdown, extraction yield, strength, and flow evenness. The live Gold Cup chart shows where the brew lands; the extraction curve shows where drawdown cuts the process off; and the bed schematic makes channeling and fines migration visible.
The simulator is a reduced-order teaching model calibrated to plausible pour-over behavior, not a laboratory prediction. Its purpose is to make directions and tradeoffs tangible—to replace another set of commandments with an experiment.
Putting the Science to Work
Physics earns its keep only if it makes the next cup easier to improve. The safest way to diagnose a brew is to separate three questions:
- Is the flavor balance under- or over-extracted?
- Is the concentration too strong or too weak?
- Did water move through the bed evenly?
The first two are the axes of the brewing control chart. The third explains why two cups with the same average extraction yield can taste entirely different.
Read the bed, then taste the cup
During brewing, look for changes rather than cosmetic perfection:
- A bloom that rises violently and resists wetting suggests that gas management is dominating the first phase.
- A crater under the stream means the pour is concentrating too much momentum in one place.
- A sudden late slowdown suggests that fines have migrated and reduced permeability.
- A sharply sloped final bed suggests asymmetric loading.
- A smooth drawdown and roughly level bed are encouraging, though neither proves uniform extraction.
Then taste. Change one variable at a time so the next cup can teach you something.
| Symptom | Likely explanation | First adjustment |
|---|---|---|
| Sharp, thin, and aromatic, but not sweet | Under-extraction | Grind finer |
| Bitter, drying, or woody | Over-extraction or too much late contact | Grind coarser |
| Sour and bitter, or weak and harsh, at once | Channeling or bypass | Improve bloom and pouring uniformity |
| Drawdown stalls late | Fines migration or a clogged filter | Reduce agitation; if needed, grind slightly coarser |
| Balanced but too intense | Concentration too high | Use more water or less coffee |
| Balanced but too weak | Concentration too low | Use less water or more coffee |
| Flat despite a normal drawdown | Water chemistry or stale coffee | Try different water or fresher beans |
If the cup is both bitter and weak, do not assume those sensations cancel into an average brew. That combination is a classic reason to suspect uneven flow: some grounds were overused and others underused. Improve wetting, flatten the bed, and make the pour less destructive before changing total contact time.
One simple experiment makes the tradeoff visible. Brew the same coffee three times with the same dose, water, grind, and temperature. In the first, use minimal agitation after a thorough bloom. In the second, stir after every pour. In the third, repeatedly aim a narrow stream at the center. Record drawdown time and, if available, TDS; then taste the cups side by side. The stirred bed may clog, the cratered bed may channel, and the gently handled bed may taste more coherent. Whatever the result, it will teach you more about your grinder and brewer than copying another recipe.
At the end of the day, whether a cup is good remains a subjective judgment. An adjustment matters only if you can taste the difference. Yet even the best technique can only manage the variance built into a mixed population of particles and a changing porous bed. That raises a final question: what would a brewer look like if it attacked the variance directly?
Building a Better Coffee Maker
A better coffee maker should meet three requirements:
- Reduce the two main sources of extraction variance: the range of particle sizes produced by the grinder and the uneven flow around those particles.
- Measure and adjust extraction while it is happening, rather than report what went wrong after the cup is finished.
- Preserve room for creativity. Users should be able to fine-tune the brewing process—and surprise themselves.
A product-design response to the physics of coffee brewing
Instead of forcing one heterogeneous bed to behave as though it were uniform, the new machine would avoid brewing a heterogeneous bed at all. It would perform four operations: sort, steep, sense, and blend.
First, it would grind the beans and sort the dry grounds into perhaps three size classes: fines, middle-sized particles, and coarse particles. A tiny mist applied to the beans before grinding could reduce static, helping the grounds move through the classifier rather than cling to its walls. The classes would not be perfectly uniform, but each would have a much narrower range of extraction times than the original grind.
Second, the machine would steep each class in a separate immersion chamber. Immersion removes the packed bed and its fragile network of flow paths. Gentle agitation would keep each chamber well mixed, while independent control of water temperature and contact time would let coarse particles brew longer without over-extracting the fines.
Third, the machine would sense extraction as it happens. A small filtered sample loop could measure the rising concentration of dissolved solids in each chamber. The controller should follow the curve—concentration, its rate of change, temperature, and time—rather than chase one final TDS number. TDS cannot identify every flavor compound, but within a narrow, well-mixed fraction it becomes a useful estimate of the chamber’s state. The machine can then stop or adjust each extraction while there is still time to change it.
Finally, it would filter the chambers and blend their extracts by mass. Fines could contribute intensity and body without dominating the whole brew; the coarse fraction could be given the time it needs; bypass water could set the final strength. A user might choose a profile such as clean, bright, sweet, or full, then adjust the fraction ratios and recipes. Repeatability would support creativity rather than replace it.
Admittedly, this design belongs more naturally on a laboratory bench than on a kitchen counter. It combines a grinder, classifier, several heated chambers, filters, valves, and an optical sensor. Oily grounds can blind a sieve, cloudy samples can foul the sensor, and fines can clog the filters. Shrinking all of that into a quiet, compact, self-cleaning appliance would be a separate—and formidable—product-design problem.
Comments
No comments yet. Be the first to share your thoughts!