
How Not to Lie to Yourself
Statistics for discerning eaters
Blind is not the same as tested
You have probably done the kitchen version of a blind preference test: two samples, identical containers, equal quantities, controlled serving temperature, and random codes instead of names such as “original” and “improved.”
You are asked to taste both and pick one.
The obvious problem is that a coin flip has a 50% chance of giving the answer you hoped for. The less obvious problem is worse: you will probably still pick one even if the two samples are identical.
Blinding removes information that might bias the answer. It does not, by itself, make the answer informative. In many places in this book, we propose a change to a kitchen procedure or recipe. If this is the test used to verify the effect of the change, one person’s preference vote can be genuine perception, random choice, or a forced decision made without reliable discrimination.
The missing ingredient is not more blindness. It’s the right test methodology and a splash of statistics.
Test detection before preference
First, we need to separate two questions that the blind test muddles together:
- Can the taster detect a difference?
- If so, which version do they prefer?
The triangle test is set up for that purpose: give the taster three coded samples. Two contain product A and one contains product B, or the reverse. Ask one question: Which sample is different from the other two?
Obviously, if the taster cannot tell, say, two tomatoes apart, their eloquent preference for the one grown under a full moon is mostly a preference for having an opinion. And we all know that there is no shortage of opinions in the food world.
Beating the guesses
The assumption that a tomato grown under the full moon is no different from any other tomato has a technical name: the null hypothesis. If a taster is forced to make a choice, they still have a one-in-three chance of correctly identifying the magic tomato. To beat the null hypothesis, you need to recruit more tasters who make independent judgments.
In a triangle test, the probability of one taster guessing the right answer is:
For a given number of independent tasters, how many of them must correctly identify the odd sample before you can be 95% sure that the panel did not merely guess?
The statistical tool for calculating this is called the binomial distribution. In the graph below, the y-axis is the probability that guessing produces at least that many correct answers, and the x-axis is the number of tasters who correctly identify the odd sample. is the number of tasters on the taste panel. is the significance threshold. If you want a result that guessing would produce less than 5% of the time, then is 5%.
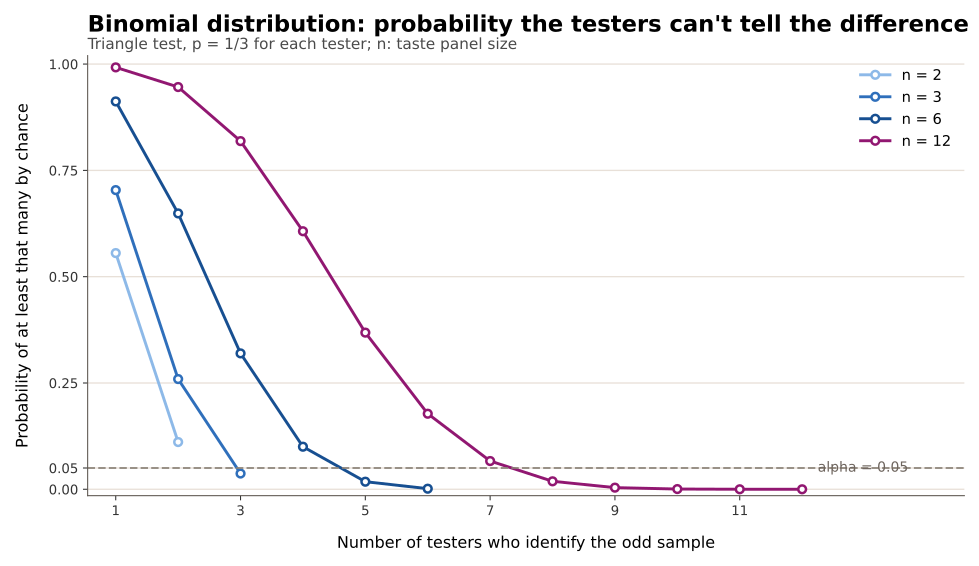
If you have a panel of 12 tasters, you need at least 8 people to pick out the odd sample before you can be 95% sure the result is not pure luck. If you have a panel of 3 people, you need all three to identify it correctly. If your panel has only 2 people, you can never be 95% sure they are not just guessing.
Practical considerations for a multi-person taste panel
There are six possible serving orders:
Use all six as evenly as the panel size allows. This balances both the position of the odd sample and which product is the odd one. Otherwise, a taster who habitually chooses the middle cup, or a sample that warms while waiting in the third position, can manufacture a result.
Each taster should make one independent choice without consulting the others. Repeated judgments by the same person are not automatically independent: they may learn, tire, or remember a code. The mathematics treats the observations as independent, so the experiment must make that assumption plausible.
Preference has its own null hypothesis
Once we have evidence that a difference exists, we can test for preference. We still have to reject a null hypothesis. There is no right or wrong answer in a preference test, but there is usually an answer we hope to hear in this kind of taste test, so in the discussion below I will call that the “target” answer.
Give each taster the two coded samples and ask which one they prefer. Let be the number of tasters who choose the target version. Because the probability of choosing the target version by chance is now 50%, higher than the 33% in a triangle test, we need more agreement to reach the same level of confidence:
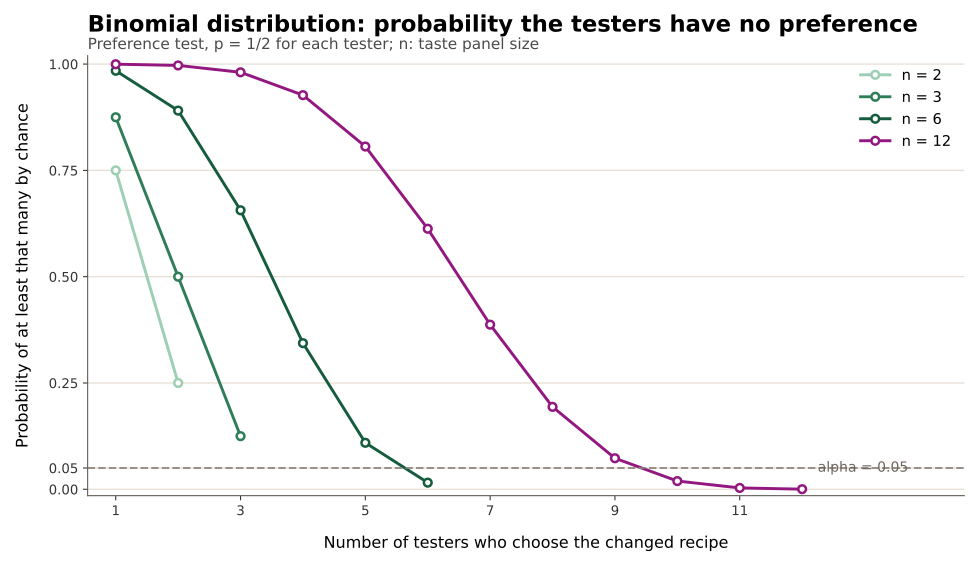
The implication is clear: if you make a change to grandma’s lemon tart recipe, you can never be sure you have made it better unless you have a big family to be your taste panel.
Unless you make a genuine and significant improvement.
The bigger the difference, the easier it is to detect
Suppose only six of the twelve tasters answer correctly. You have failed to reject guessing. You have not proved that no difference exists.
Perhaps the difference is detectable only by some people. Perhaps it disappears when the samples cool. Perhaps the panel is too small. If a genuinely perceptible difference makes each taster correct with probability , and the experiment declares detection at or more correct answers, its probability of finding that difference is
This is the test’s power. The threshold is set by the guessing model above: you still need 8 out of 12 to be confident the result is not random guesses. But a larger means the chance of reaching 8 correct answers rises.
The triangle test cannot tell us why two foods differ, how large the sensory difference is, or which one is better. It does one narrower job: it makes a claimed perception compete against a precise model of luck. A preference test does a different narrow job: it makes a claimed improvement compete against the 50/50 result expected when neither version is preferred. Before asking what heat, salt, or time does to food, that separation is a useful piece of intellectual hygiene.
Comments
No comments yet. Be the first to share your thoughts!